
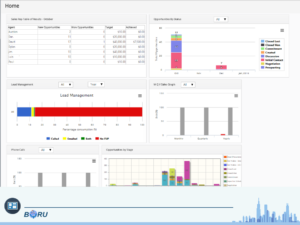
When you log into Vtiger, you’re doing it for a reason. You need to know about your monthly sales, your new contacts, your profitability for the last month and your forecast for the next — and you need to know about it now. You need to know which areas need your attention immediately, and which ones don’t. That’s why we built the highly customizable Boru Dashboard Module. Everything’s color-coded to tell you what’s going well and what isn’t. Mouse over any tile to see more information, or click through to drill into the details. No more sifting through page after page of data and hard-to-understand displays. Check out our screenshots to see what we mean.
When you log into Vtiger, you’re doing it for a reason. You need to know about your monthly sales, your new contacts, your profitability for the last month and your forecast for the next — and you need to know about it now. You need to know which areas need your attention immediately, and which ones don’t. That’s why we built the highly-customizable Boru Dashboard Module. Everything’s color-coded to tell you what’s going well and what isn’t. Mouse over any tile to see more information, or click through to drill into the details. No more sifting through page after page of data and hard-to-understand displays. Check out our screenshots to see what we mean.
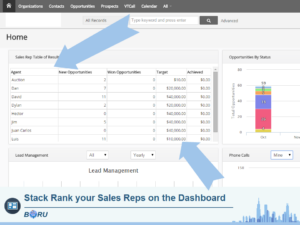
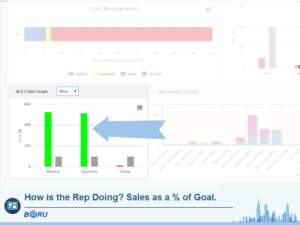
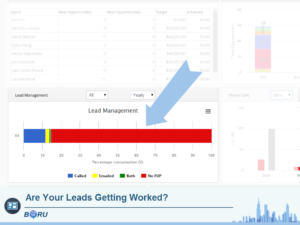
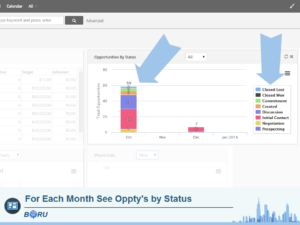
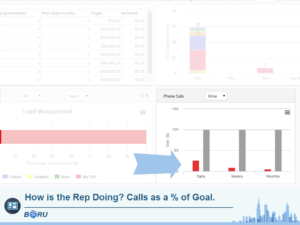
Choose as many interactive graphs as you like from several different categories. Whether you’re a manager who needs an overall view of sales pipelines and team performance, or a representative who needs to keep tabs on daily calls, appointments, and sales goals, Boru Dashboard has everything you need.
Vtiger Version: 6.X
PHP Version: 5.2, 5.3, 5.4, 5.5