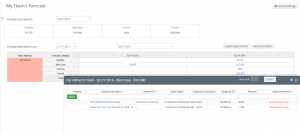
Sales forecasting in Vtiger is an important sales management function. Vtiger 7 (as seen in the current Vtiger on demand) has a very functional, though not too exciting, forecasting capability. It would be nice for Vtiger to incorporate some more graphics, but hopefully that is coming.
At the top of the screen, you can see the aggregate sales in the different opportunity stages for Q2 2016. You can flip the picklist to different quarters to see further forward/back.
Below you can see the breakdown for individual sales reps. This an easy to use view to get a sense for the state of the sales team’s pipeline into the future. Note: there is no weighting applied by applying the probability of close. That seems like an oversight to me.
A nice feature is the ability to click on any number and see a pop-in with the list of opportunities that make up that number. I like the pop-in versus navigating away from the page


